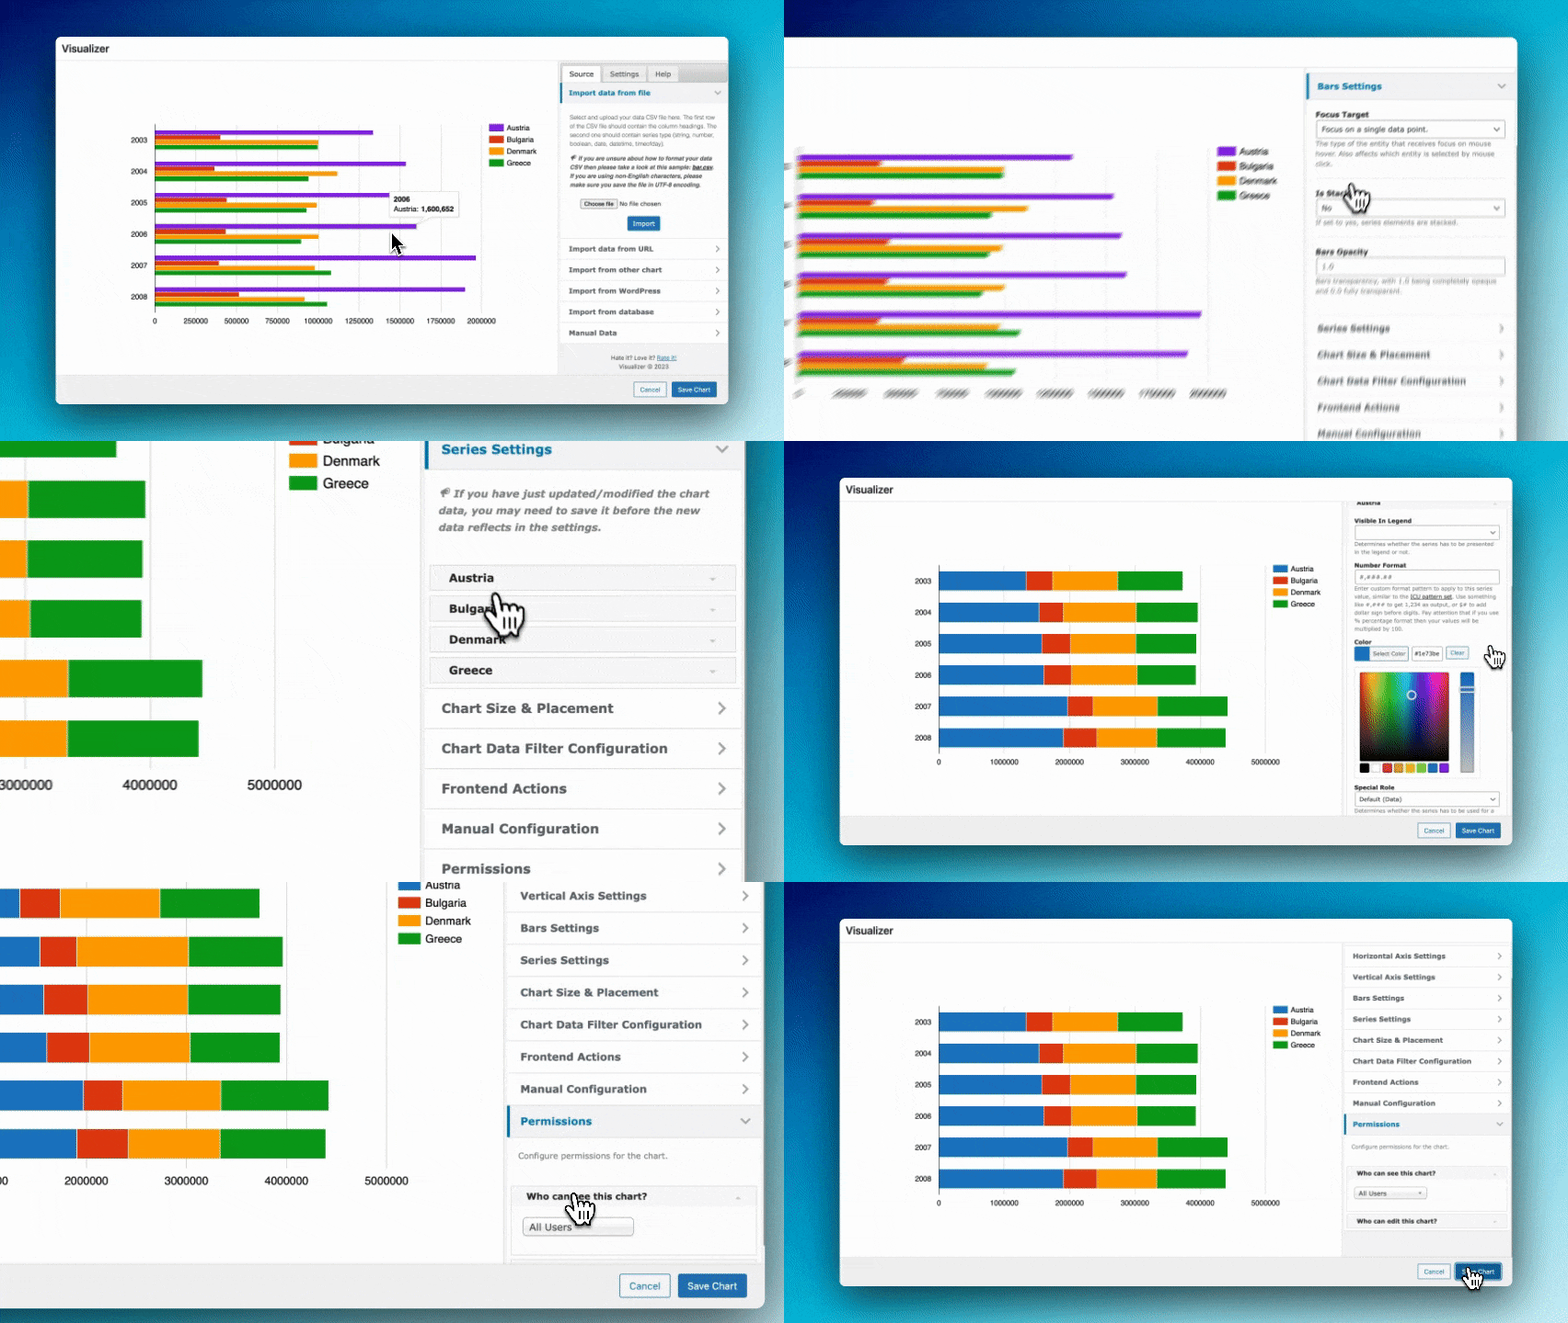
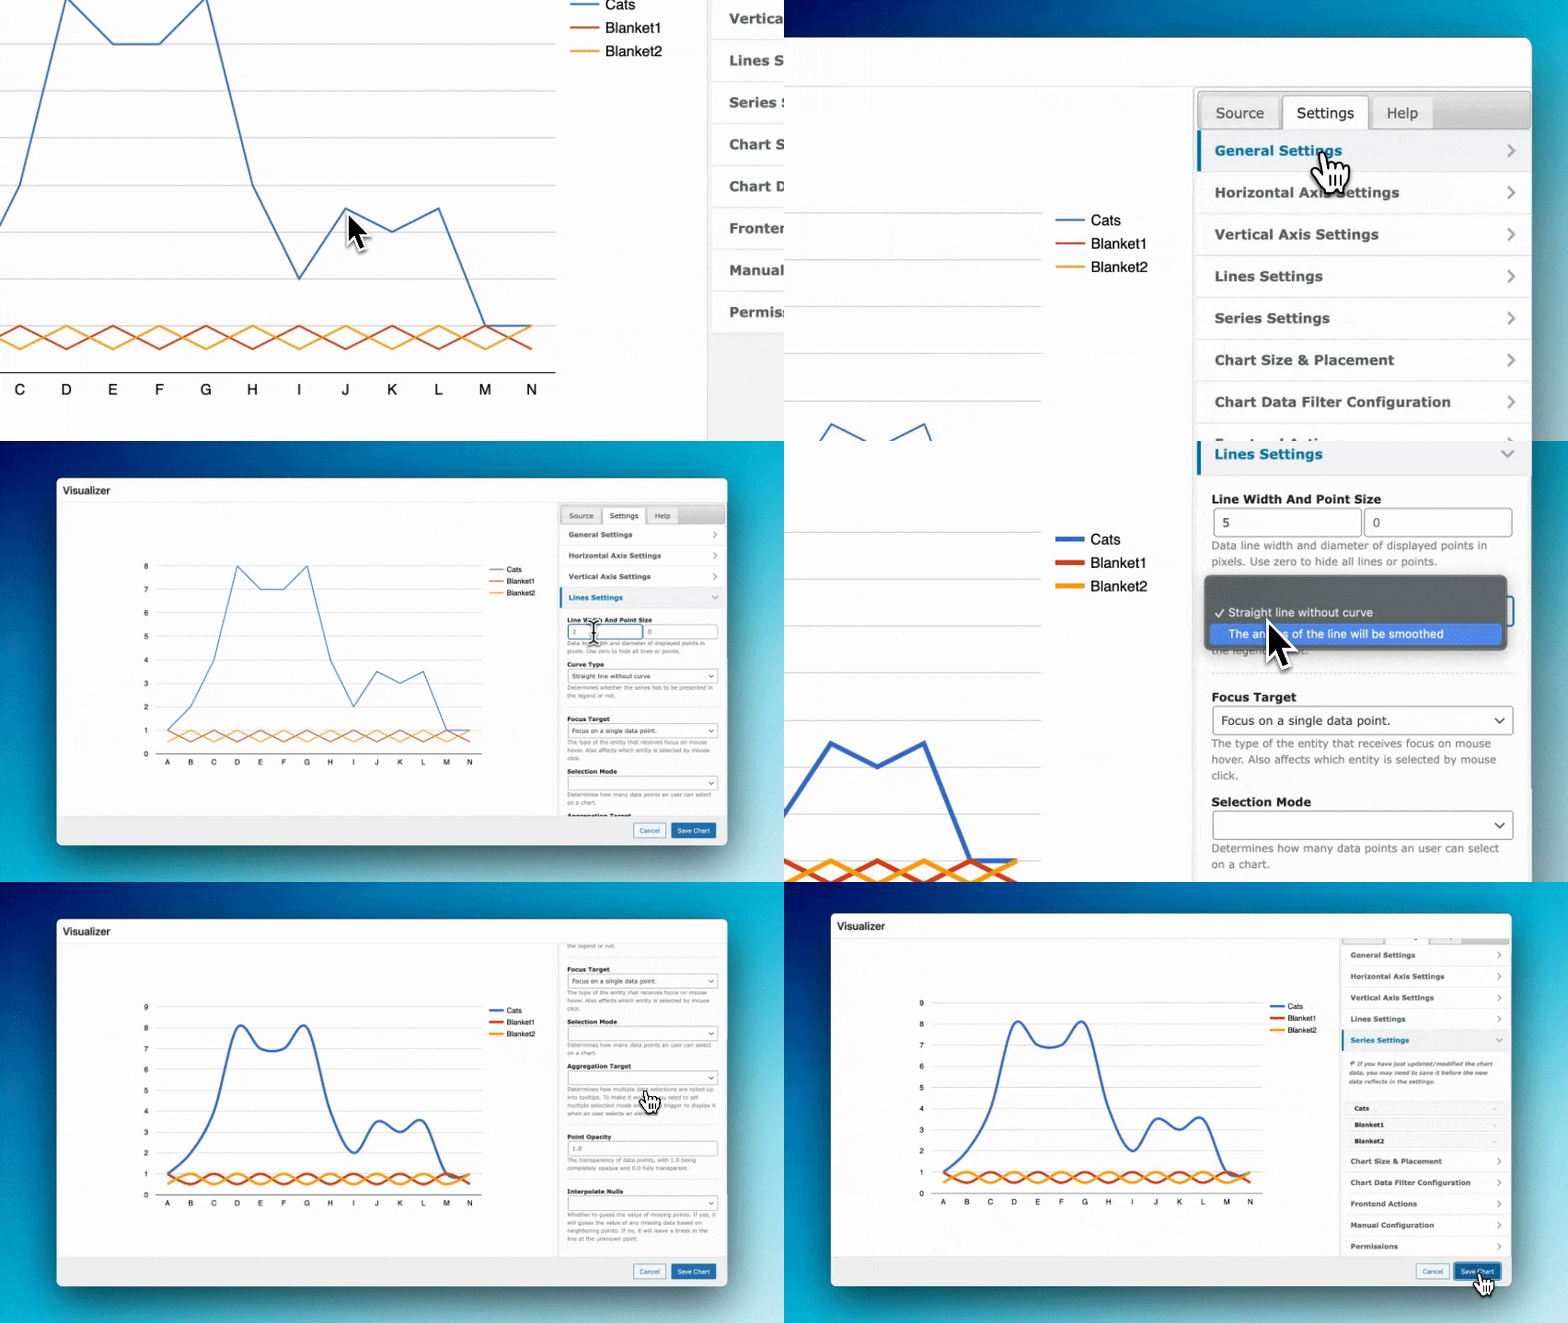
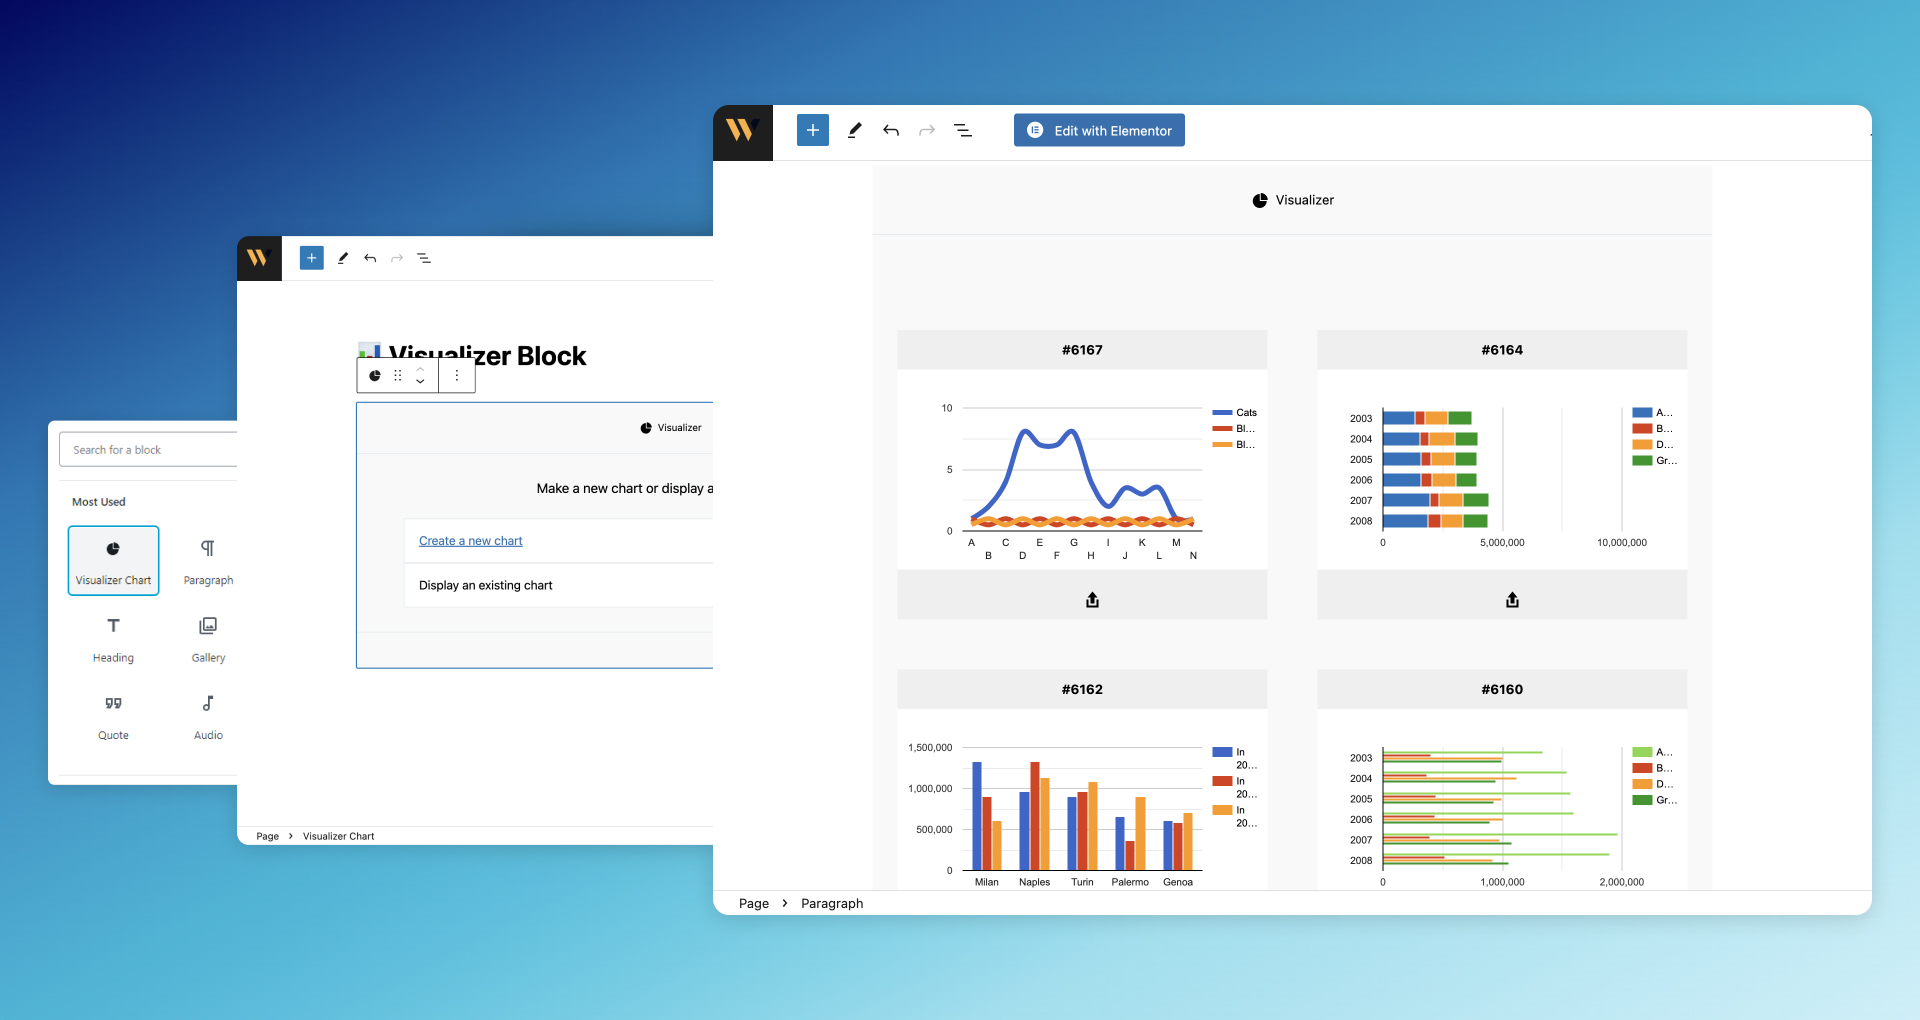
Descripción
Visualizer: Tables and Charts for WordPress plugin is a powerful and easy to use plugin used to create, manage and embed interactive, responsive charts & tables into your WordPress posts and pages.
The plugin uses Google Visualization API, DataTables.net and ChartJS to add responsive & animated charts, graphs and tables, which support cross-browser compatibility and display perfectly on mobile devices. You can greatly customize all aspects of the charts and tables, and import the data from Excel, CSV, Google Sheets and more!
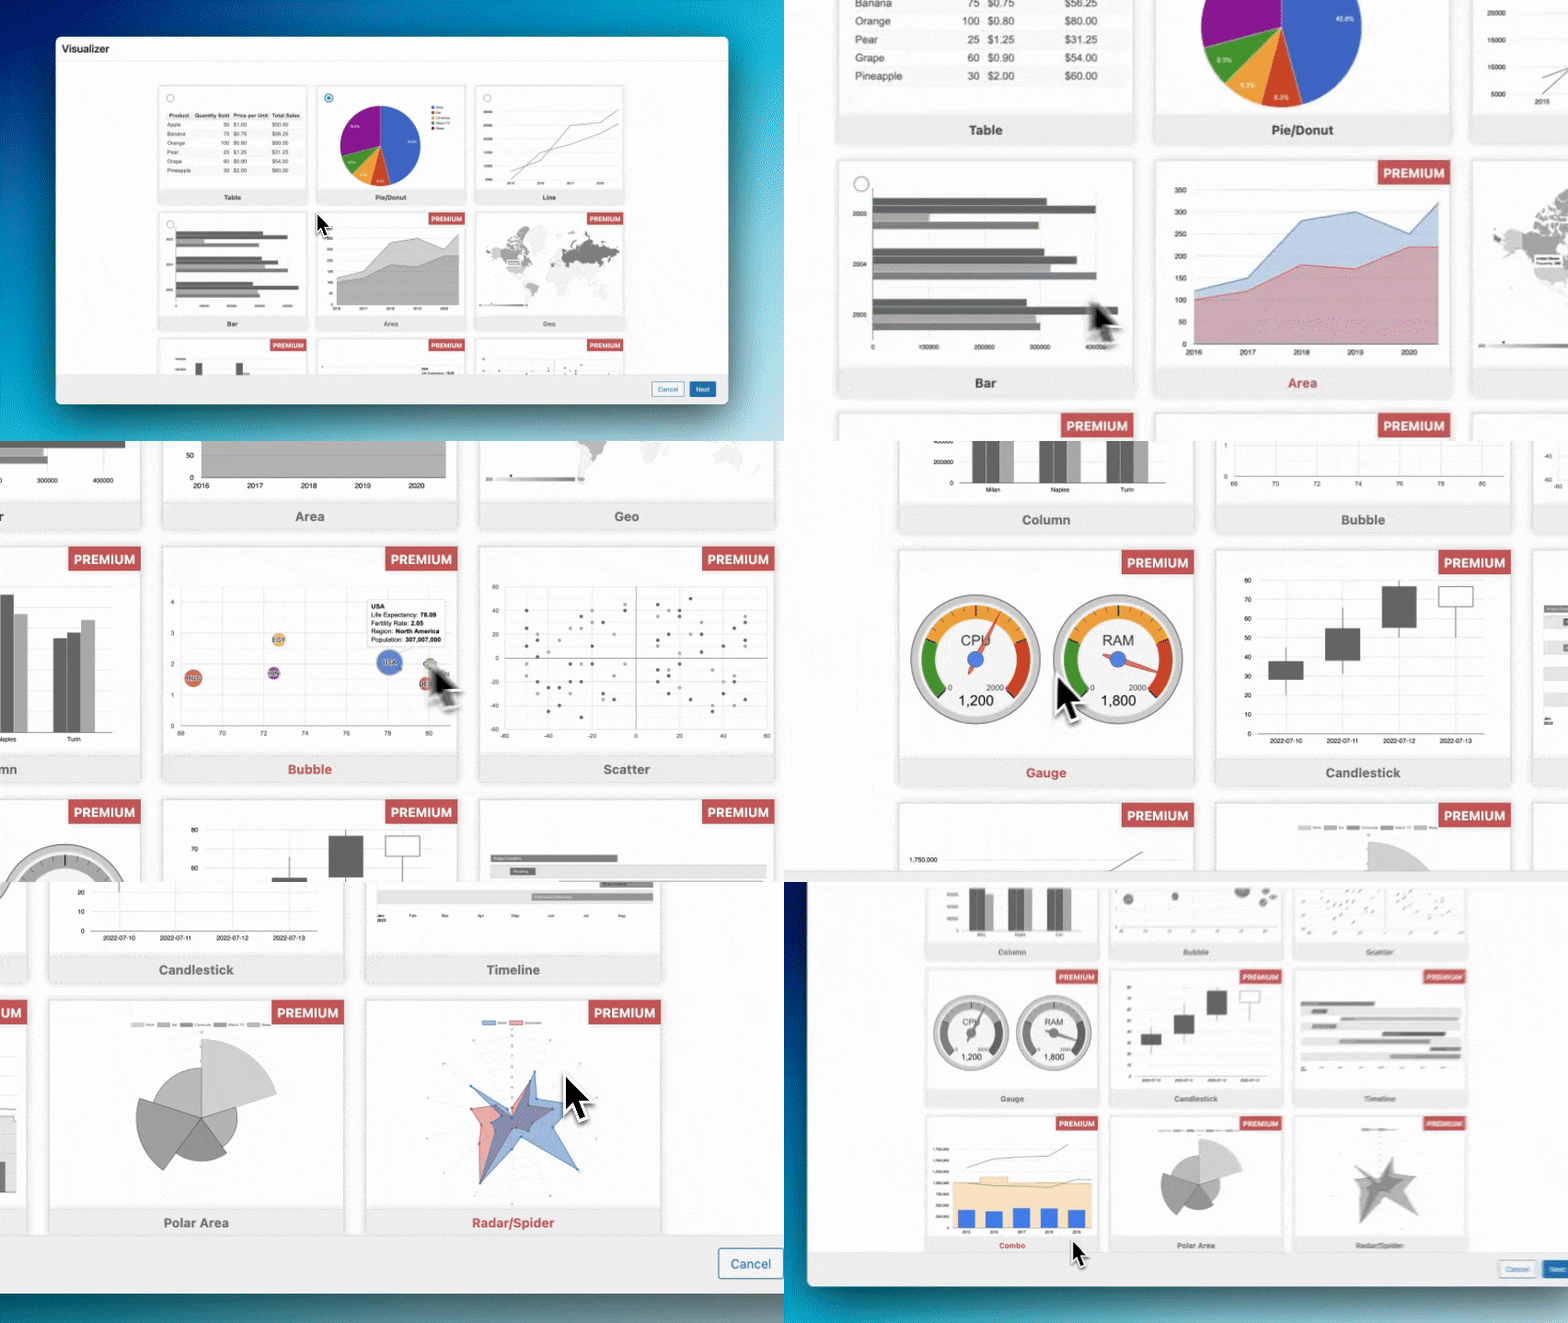
4 Chart types + 11 more in the pro version
This WordPress graph plugin provides a variety of charts that are optimized to address your WordPress data visualization needs. In the free version, it has line charts, bar charts, pie charts, table charts. These charts are based on pure HTML5/SVG technology (adopting VML for old IE versions), so no extra plugins are required. Adding these charts to your page can be done in a few simple steps.
One of the best table plugin for wordpress
On top of our responsive charts and graphs, you can also add our responsive tables to your posts and pages, and customize them however you like. Not only can you customize the design of the tables, you can add sorting capabilities, pagination, search and more. You can view a few examples of what can be done here, but many more things can be done, including pricing tables and product tables.
Flexible y personalizable
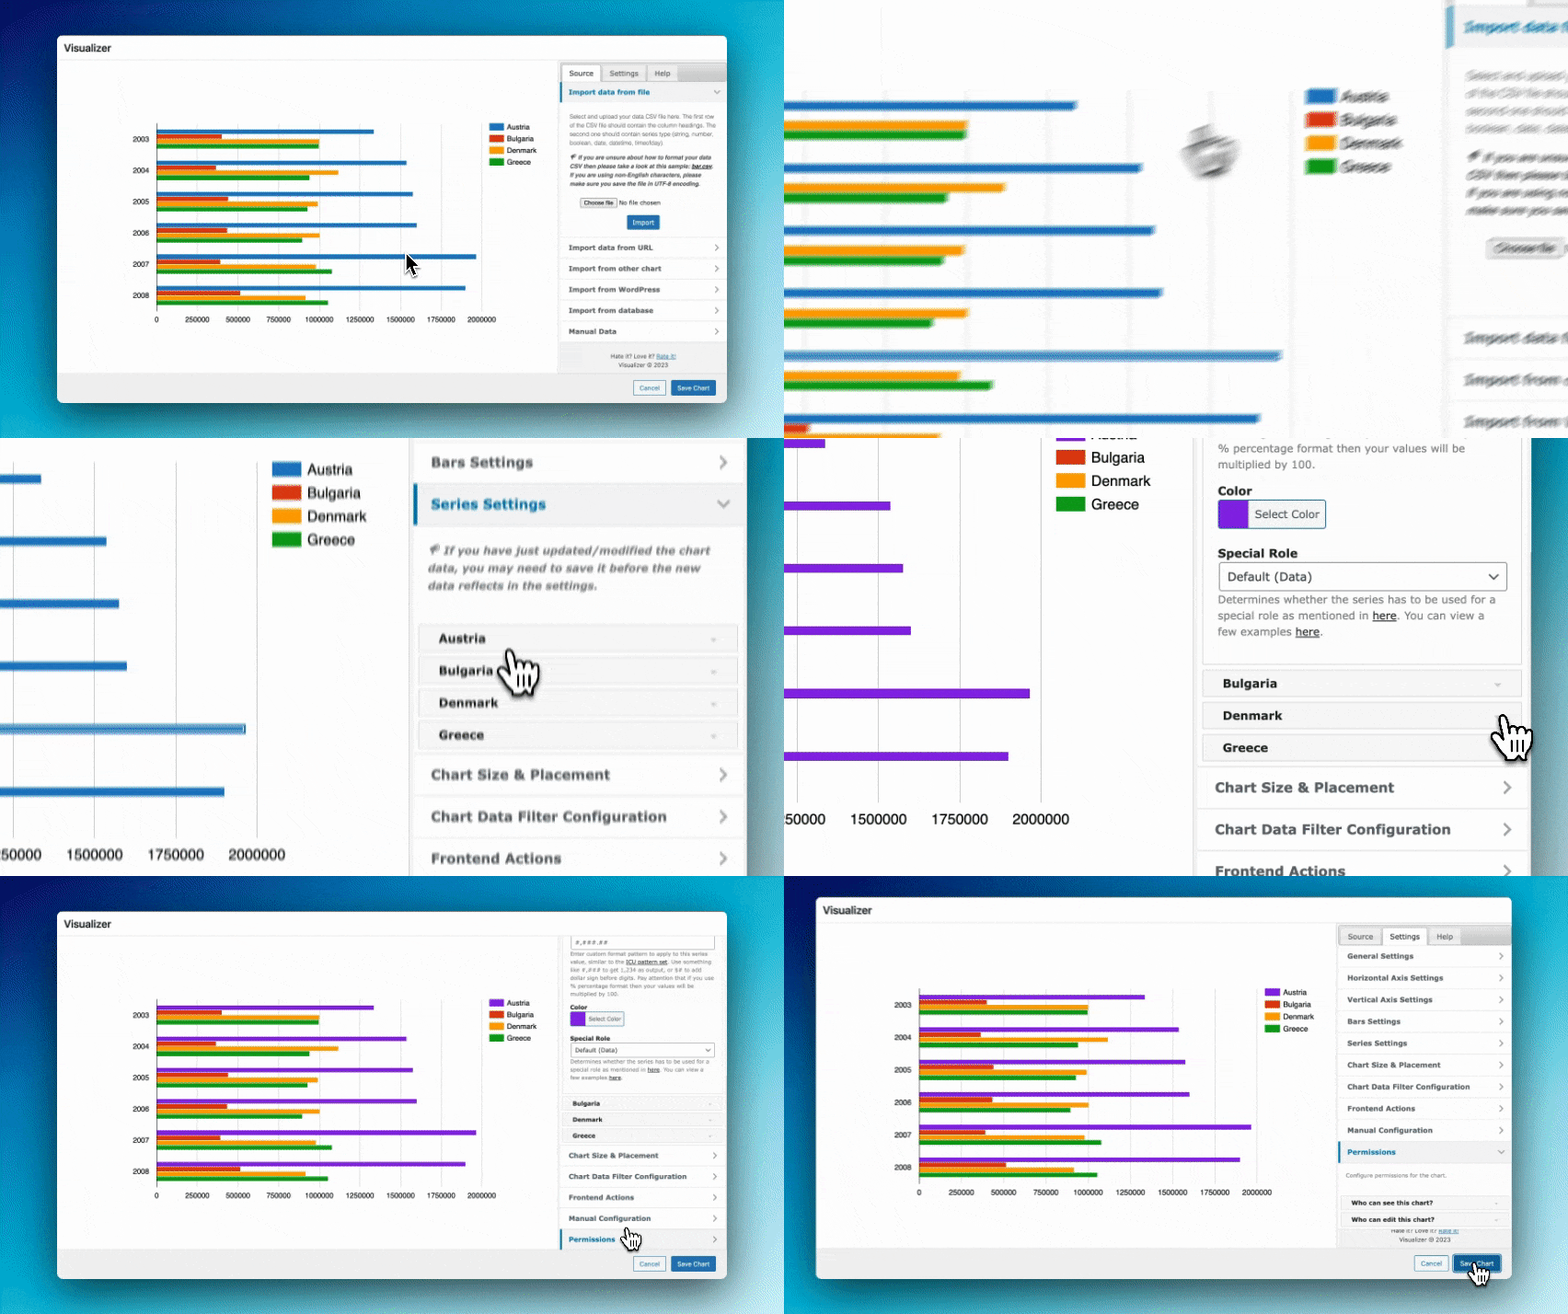
Make the charts your own. Configure an extensive set of options to perfectly match the look and feel of your website. You can use Google Chart Tools with their default setting – all customization is optional and the basic setup is launch-ready. However, charts and graphs can be easily customizable in case your webpage adopts a style which is at odds with provided defaults. Every chart exposes a number of options that customize its look and feel.
Gutenberg support
Whether you like Gutenberg or not, it doesn’t matter, you can add your charts using our easy-to-use gutenberg interface, or simply paste your chart code on the old editor.
Responsive Charts in HTML5/SVG
Los gráficos se representan utilizando la tecnología HTML5 / SVG para proporcionar compatibilidad entre navegadores (incluido VML para versiones anteriores de IE) y portabilidad multiplataforma para iPhone, iPad y Android. Tus usuarios nunca tendrán que meterse con complementos adicionales o ningún software. Si tienen un navegador web, pueden ver tus gráficos.
Las descripciones anteriores se tomaron parcialmente del sitio de la API de visualización de Google
Time-saving features available in the Pro version:
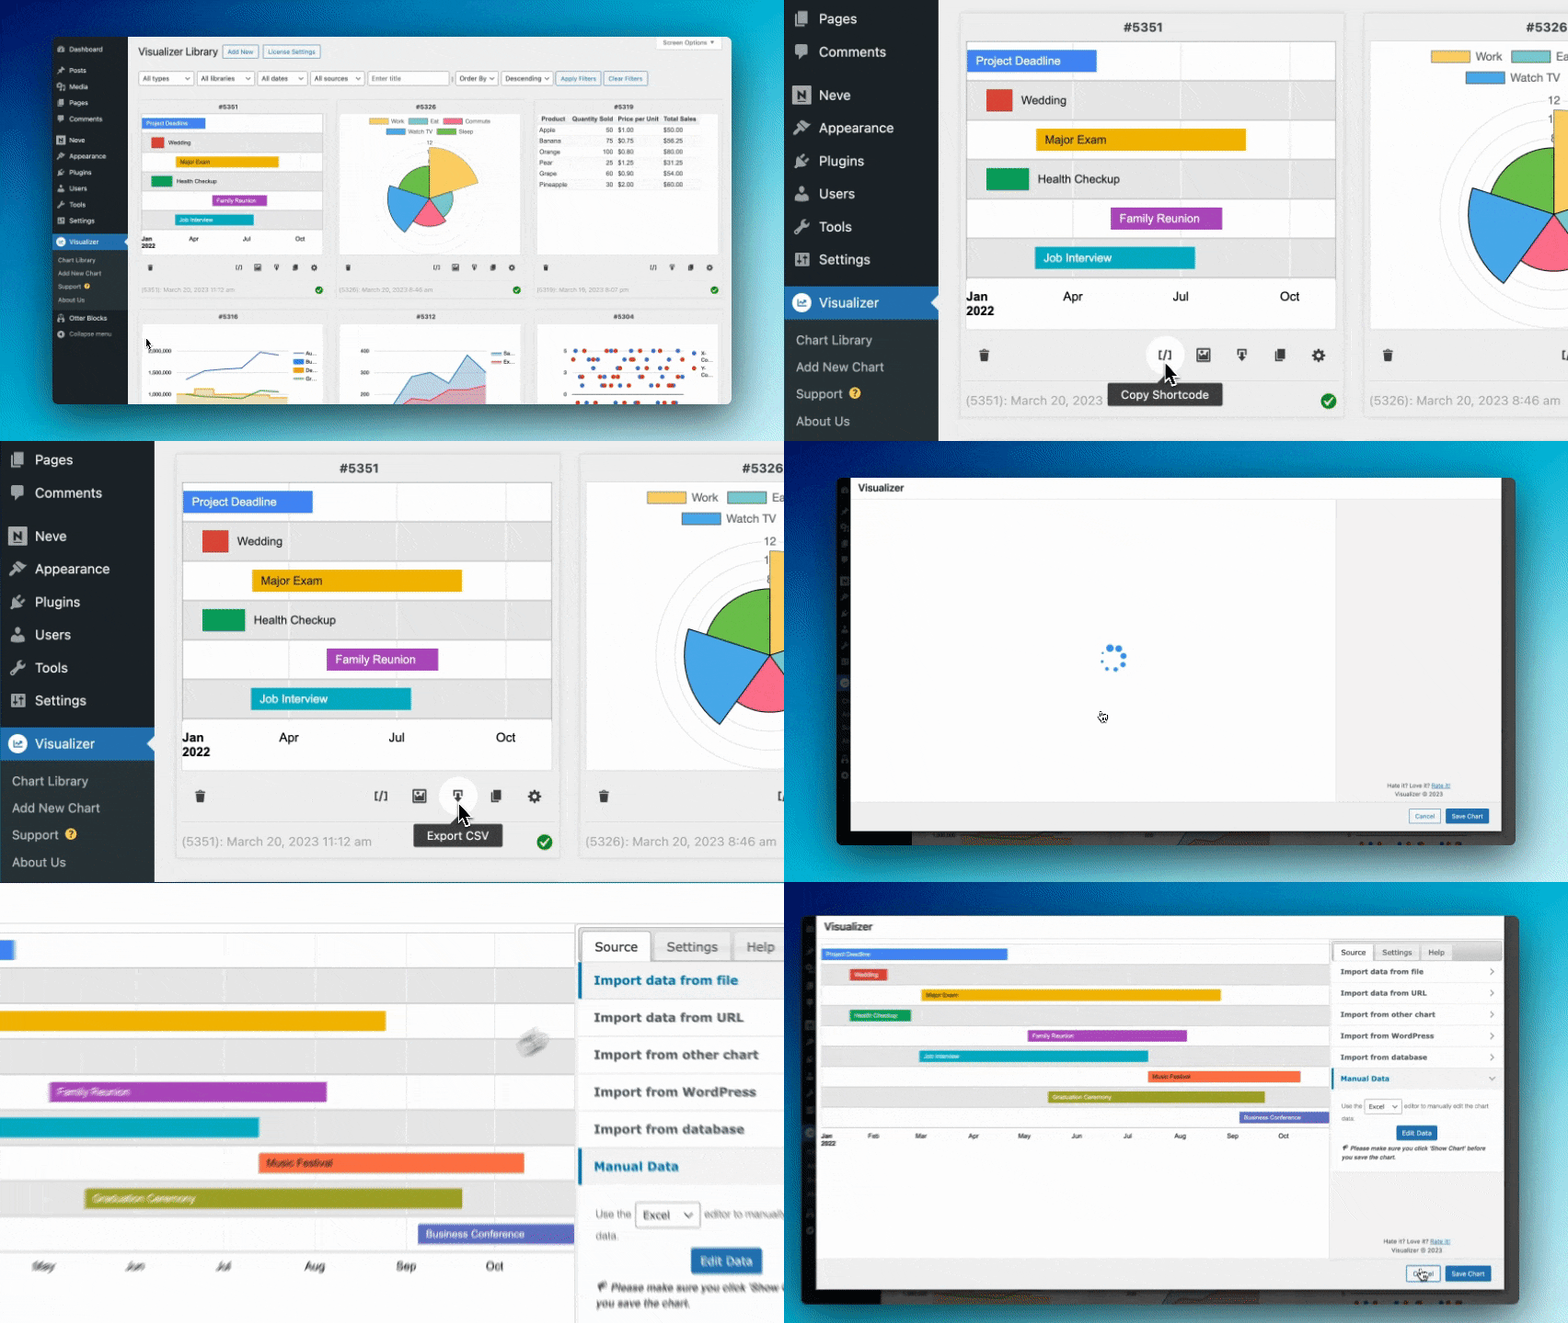
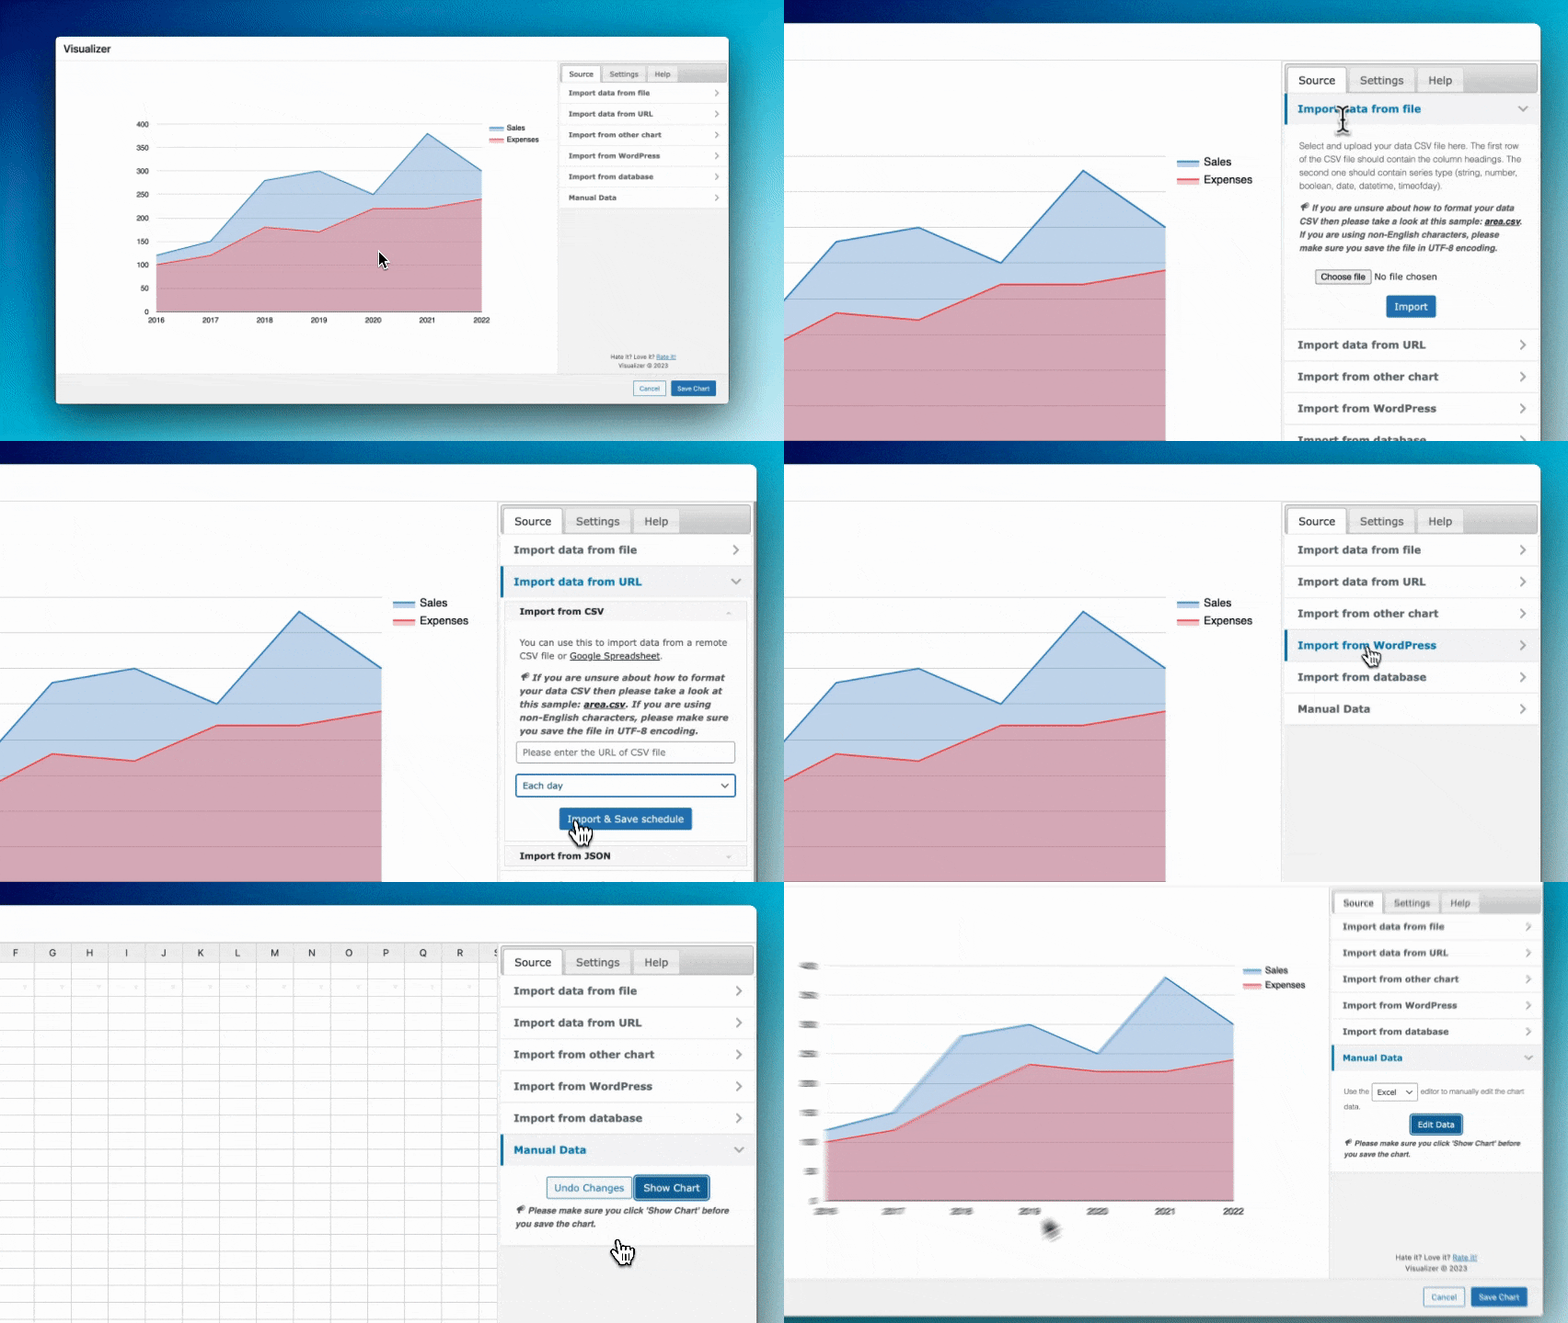
- Import data from other charts, graphs and tables
- Easily edit the data using a excel-like data editor
- Gain access to 11 more chart types ( Area, Geo, Column, Bubble, Scatter, Combo, Timeline, Candlestick, Gauge, Radar/Spider, Polar Area )
- Import data from any database
- Synchronize your data periodically
- Create private charts (customizable permissions system)
- Allow visitors to edit charts
- Create charts from your wordpress posts, pages,products or any other post_type
- Priority email support from the developer of the plugin
- Support and updates for as long as your subscription is valid
The plugins works perfectly with the all free or premium WordPress themes
See how Visualizer can integrate with your website
- Create line chart
- Create pie chart
- Create bar chart
- Create column chart
- Create area chart
- Create geo chart
- Create table chart
- Create gauge chart
- Create candlestick chart
- Create combo chart
- Create scatter chart
- Create timeline chart
- Create radar/spider chart
- Create polar area chart
- Create bubble chart
Capturas
Bloques
Este plugin provee 1 bloque.
- Visualizer Chart
Instalación
- Subí los archivos al directorio
/ wp-content / plugins / visualizer /. - Activá el plugin a través del menú “Plugins” en WordPress
Preguntas frecuentes
-
Los atajos no se convierten en gráficos
-
Tené en cuenta que para convertir sus códigos cortos en gráficos, tu tema debe tener
& lt;? Php wp_footer (); ? & gt;llame al final del archivo footer.php . -
Is there any documentation available for this plugin?
-
http://docs.themeisle.com/article/428-visualizer-charts-and-graphs-documentation
-
How to format chart series values?
-
http://docs.themeisle.com/article/672-how-to-format-series-values
-
How to create charts from your WordPress posts?
-
http://docs.themeisle.com/article/673-how-to-create-charts-from-your-wordpress-posts
-
How to automatically sync charts with online files?
-
http://docs.themeisle.com/article/674-how-to-automatically-sync-charts-with-online-files
-
How can I create/add a chart?
-
How can I edit a chart?
-
http://docs.themeisle.com/article/602-how-can-i-edit-a-chart
-
How can I delete a chart?
-
How can I clone a chart?
-
How can I highlight a single bar?
-
http://docs.themeisle.com/article/603-how-can-i-highlight-a-single-bar
-
How can I populate chart series and data dynamically?
-
http://docs.themeisle.com/article/605-how-can-i-populate-chart-series-and-data-dynamically
-
How can I populate data from Google Spreadsheet?
-
http://docs.themeisle.com/article/607-how-can-i-populate-data-from-google-spreadsheet
-
How can i import content from another chart?
-
http://docs.themeisle.com/article/609-how-can-i-import-content-from-another-chart
-
How to export a chart?
-
How can i edit the data manually?
-
http://docs.themeisle.com/article/610-how-can-i-edit-the-data-manually
-
http://docs.themeisle.com/article/675-how-to-enable-frontend-action-buttons
-
How to use Google Visualization variables?
-
http://docs.themeisle.com/article/691-how-to-use-google-visualization-variables
Reseñas
Colaboradores y desarrolladores
“Visualizer: Tables and Charts Manager for WordPress” es un software de código abierto. Las siguientes personas han colaborado con este plugin.
Colaboradores“Visualizer: Tables and Charts Manager for WordPress” ha sido traducido a 5 idiomas. Gracias a los traductores por sus contribuciones.
Traduce “Visualizer: Tables and Charts Manager for WordPress” a tu idioma.
¿Interesado en el desarrollo?
Revisa el código , echa un vistazo al repositorio SVN , o suscríbete al log de desarrollo por RSS .
Registro de cambios
Version 3.10.13 (2024-04-17)
Fixes
- Updated internal dependencies: Enhanced performance and security.
Version 3.10.12 (2024-04-15)
Fixes
- Updated internal dependencies: Enhanced performance and security.
Version 3.10.11 (2024-04-01)
Fixes
- Updated internal dependencies
- Improved E2E testing
Version 3.10.10 (2024-03-28)
Fixes
- Fixed blueprint schema for Live Preview
Version 3.10.9 (2024-03-27)
Fixes
- Visualizer live preview fixed
- Updated internal dependencies
Version 3.10.8 (2024-03-14)
Bug Fixes
- Fix Google chart rendering condition for Classic Plugin
- Changes the speed and position of the loading bar
Improvements
- Add a Live Preview button for the plugin page on wordpress.org
- Added NPS survey
Version 3.10.7 (2024-02-06)
Fixes
- Rendering charts that are under tabs/hidden containers
- Updated dependencies
- Updated CTA buttons
- Updated UTM campaign links
Version 3.10.6 (2024-01-18)
Fixes
- Enhanced security
Version 3.10.5 (2023-12-19)
Improvements
- Added chart responsive support
- SDK Updates
Bug Fixes
- Fixed chart data filter issue
- Fixed animation issue fusion builder
- Fixed live import issue with Gutenberg block
- Fixed tooltip text rendering issue in ChartJS
- Fixed onboarding chart import issue
- Removed PHP deprecated function
- Fixed compatibility issue with WP VIP
- Fixed PHP 8.1 deprecated error
Version 3.10.4 (2023-08-17)
- Updated dependencies
- Updated WordPress version required to 5.2 or higher
Version 3.10.3 (2023-06-13)
- Removed branding label
Version 3.10.2 (2023-06-05)
- Added About Us page integration
- Updated dependencies
Version 3.10.1 (2023-05-24)
- Fixed data tables horizontal scrolling issue
- Added legend position default label text
- Added tooltip default label text
- Fixed Gutenberg block error
- Fixed table chart rendering issue in Gutenberg block
- Fixed compatibility issue with the FSE editor
- Fixed compatibility issue with WP 5.6
- Fixed console error when importing charts from others
- Fixed pagination enable/disable issue
- Fixed editor rows limitation issue
Version 3.10.0 (2023-04-04)
- Added a setup wizard onboarding page
- Fixed empty chart issue
Version 3.9.7 (2023-03-30)
- Improved chart actions icons
- Updated WordPress core tested up to version
Version 3.9.6 (2023-03-20)
- Fixed custom format issue in ChartJS
Version 3.9.5 (2023-01-30)
- Improved security by escaping shortcode attribute before render
- Compatibility with PHP 8.2
Version 3.9.4 (2023-01-12)
- Fixed the lock of PRO features bypass
Version 3.9.3 (2023-01-05)
- Fixed the chart refresh problem when importing from CSV #970
Version 3.9.2 (2022-12-21)
- Fixed Geo chart [PRO] flickering issue
- Added disable legend option for ChartJS chart
- Enhanced security
Version 3.9.1 (2022-11-17)
- Fixed PHP error when Polylang plugin is activated #960
Version 3.9.0 (2022-11-10)
- Fixed table chart decimal number issue Decimal Numbers are ignored and not displayed #955
- Fix the scrollbar issue that happens on WP 6.1 version [WP 6.1] Chart permissions selector is not scrollable #950
- Fix PHP Warning Warning when copy (frontend action) is enabled #949
- Compatibility with the WPML translation plugin for translating charts [PRO feature] add support for string translations #731
- Integration with Woocommerce Data endpoints for creating charts [PRO feature]
- Show new features on chart library page
Version 3.8.1 (2022-10-12)
- Change copy shortcode icon to clone a chart We can change copy Short Code icon #945
- Fix temp file creation issue on instawp selecting the line chart is not working on instawp #940
- Fix control Type error
- Fixed simple editor scrolling issue
- Fix filter broken layout
- Fix chartJs javascript error when rendering multiple charts
Version 3.8.0 (2022-09-21)
- Add data filter support for the charts
Version 3.7.12 (2022-09-07)
- Fixed compatibility issue with some themes and plugins #933
Version 3.7.11 (2022-08-30)
- Fix update axis baseline color #925
- Update more features images #926
- Fix update minor grid line field #924
- Add new filter for container attributes #922
- Fix axis data format issue #920
- Chart unique title #915
- Fix block back button issue #930
- Userguide broken documentation link #918
Version 3.7.10 (2022-07-05)
- Fix watermark/copyright opacity wrong value #910
Version 3.7.9 (2022-06-22)
- Fix branding bad HTML
Version 3.7.8 (2022-06-21)
- Add the description field in the pie chart
- Fix Label other is not visible on the pie chart
- Fix the pagination issue in the chart library
- Update dependencies
Version 3.7.7 (2022-05-31)
- Harden security by enforcing escaped urls.
Version 3.7.6 (2022-05-26)
- Fix PHP 8.0 or above compatibility issue
- Fix the space missing between the id and class attributes of the charts
- Fix compatibility issue with Ultimate Coupons for WooCommerce Free plugin
- Fix charts placed in accordion (tabs) that do not load properly
- Fix conflict with translation plugins
Version 3.7.5 (2022-03-17)
- Fix display long hAxis text issue
- Improve features discoverability.
Version 3.7.4 (2022-02-07)
- Fix multiple lazy load charts issue
- Tested up to WordPress 5.9 version
Version 3.7.3 (2022-01-19)
- Fix multiple charts lazy rendering issue
- Upgrade jQuery UI core library CDN
- Fix console error when rendering multiple charts
- Keep only Line / Pie / bar / Table charts in free version
Version 3.7.2 (2021-12-20)
- Add latest chartJS library support in the bar chart
- Fix horizontal axis showing date format in Bar chart
- Fix orientation rotate issue in mobile
- CSS performance improvements
- Improve JS performance
Version 3.7.1 (2021-11-17)
- [Feat] Allow charts to render in dashboard areas via 3rd party plugins like Dashboard Widgets Suite
- [Fix] Changing Line Chart series style to dot on some series changes the order of tooltip information
- [Fix] Problem with X-Axis of Line chart on Safari if date/datetime is used as values
- [Fix] Multiple Visualizer charts causing rendering issues (blank page)
- [Fix] Charts are not resizing on landscape view on mobile
- [Fix] Notices/Warnings appear on the front-end if the user is not logged in for some charts
- [Fix] Radar/Spider Chart Tooltip in PRO does not show the data value
Version 3.7.0 (2021-10-07)
Features
- Add option to enable/disable save the chart image
- Enhanced caching
Fixes
- Fix undefined variable errors when using Gutenberg blocks
- Fix broken chart in iOS and Safari
- Fix custom refresh time support for DB chart
- Fix table placed inside accordion cannot be scrolled down (refreshes all the time)
- Fix pagination doesn’t work in the library
- Fix HTML entities in JSON break Visualizer Table Chart
- Fix string type columns affect the target of the formatting applied to a number column
Version 3.6.1 (2021-08-04)
- Fix broken dropdown style issue
- Add block support in widget area
- Add wp alpha color picker support
- Fix broken chart layout issue when add long title
Version 3.6.0 (2021-07-08)
Features
- Adds option to render chart as image
- Automatically render chart as image on AMP
Fixes
- [Chart Type: TABLE] When adding a blank header, the last column of the table disappears
- Styling is not applied to Chart Area for Table Chart ( Margin, Width, Height)
- Improve compatibility with Site Kit by Google
- Loading icon doesn’t disappear until you edit the chart again [Line Chart]
- Broken chart if used inside an accordion (expand/collapse)
Version 3.5.1 (2021-05-25)
- Fix compatibility with 3rd party plugins which use the same js library as Visualizer #801
- Fix fatal error when a new chart is created on PHP 8 #795
- Chart doesn’t get refreshed automatically when the JSON endpoint is used as the data source
Features:
- Adds option to add schema.org Dataset for license and creator #794
Version 3.5.0 (2021-04-28)
Fixes
- Permissions tab disappears after a user modifies a chart’s data
- Conflict with Edit Flow plugin
- Improve compatibility with Ninja Forms
- Fix for color for Minor Grid Lines not working
Features
- Add support for key:value header to access JSON endpoints
- Option to download CSV data of the chart without the row with series type
3.4.11 – 2021-02-16
[Feat] Tested up to WP 5.6
3.4.10 – 2020-12-09
- [Fix] Compatibility with Composer 2.0
3.4.9 – 2020-11-26
- [Fix] Pie chart slices offset problem in the Gutenberg editor
- [Fix] Warning is thrown when remote file is used as source
- [Fix] Bubble chart legend position not working in the Gutenberg editor
3.4.8 – 2020-09-29
- [Fix] Option to edit charts imported from JSON
3.4.7 – 2020-09-21
-
- [Fix] Import from JSON: Reordering columns only reorders the label, not the associated data
-
- [Fix] numberFormat option doesn’t apply in Bar charts when using annotations
-
- [Fix] Google GEO chart is not rendering if 3rd data column is added
3.4.6 – 2020-08-11
-
- [Feat] Show chart ID in the chart library
-
- [Fix] Compatibility with WP 5.5
-
- [Fix] Google charts: Series number format not applying in the Gutenberg editor
-
- [Fix] Google Table chart does not display chart if boolean values are specified
-
- [Fix] Duplicated enque for jsapi loader
3.4.5 – 2020-07-08
- [Feat] New Google Table Charts
- [Feat] Option for lazy loading Google Charts
- [Feat] Option to easily copy chart shortcode code
- [Fix] Remove Inside the Chart option for the legend position for Google Pie charts
3.4.4 – 2020-06-16
- [Feat] Option to download charts as .png images
- [Fix] Make UI more intuitive when a chart is missing in the editor
- [Fix] Clicking Copy chart shows the Copied message multiple times
- [Fix] Conflict with Modern Events Calendar plugin
- [Fix] Chart size ( width and height ) options not working for ChartJS charts
- [Fix] Resizing the window causes annotation-based charts to throw an error
- [Fix] Remove Inside the Chart option as legend position for Google Pie charts
- [Fix] Clicking Advanced Options panel breaks Bubble chart
- [Fix] Missing posts revisions on chart update
3.4.3 – 2020-05-04
- [Feat] Improved chart creation UX
- [Feat] New option to control the number of charts per page in the Charts Library
- [Feat] New option for filtering/ordering charts in the Charts Library
- [Feat] Support for custom codes for the boolean data type in Table charts
- [Fix] Support for displaying apostrophes in charts
- [Fix] Visualizer button layout in the Classic block
- [Fix] Bulk activation of plugin aborts activation of subsequent plugins
3.4.2 – 2020-02-17
- New Cypress tests for the Gutenberg block
3.4.1 – 2020-02-14
- [Fix] Insert chart button in the classic block
- [Fix for Pro version] Import from chart did not work
3.4.0 – 2020-02-13
- [Feat] Support for authentication for JSON import
- [Feat] New chart type: Bubble
- [Feat] Combine one-time import and schedule import into a single control for an online .csv file import
- [Feat] Add support for annotations and other roles
- [Feat] For every chart show the last updated date and any error that exists
- [Feat] Tested up to WP 5.3
- [Fix] When new data is imported using csv/url, the manual editor still show old data
- [Fix] Having SCRIPT_DEBUG on causes issues in real time update of charts
- [Fix] Table chart: Error appears when trying to import from JSON
- [Fix] PHP Fatal error: Uncaught Error: Cannot unset string offsets
- [Fix] Long responsive table can overflow on smaller screens
3.3.4 – 2019-11-15
- Fix issue with table chart not loading in the block editor
3.3.3 – 2019-11-12
- Tested upto WordPress 5.3
3.3.2 – 2019-10-03
- Add support for Dataset schema
- Horizontal Axis formatting should apply to tooltips
3.3.1 – 2019-09-28
- Increase minimum requirement to PHP 5.6
- Fixed issue with loading customization.js on multisites
- Fixed issue with manually editing a remotely loaded chart
- Fixed issues with cloning
- Fixed issues with ChartJS assigning default colors
- Fix security issues in block editor
3.3.0 – 2019-08-14
- Add support for ChartJS
- Add alpha color picker for supported charts
- Fix issue with some options of DataTable
- Include DataTable charts in block editor
- Fix issue with import from JSON not working with some sources
- Add menu and onboarding page
- Fix issue with frontend action checkboxes
- Improve UX in advanced settings
3.2.1 – 2019-05-05
- Fix issue with async loading of scripts
3.2.0 – 2019-05-03
- Add support for charts in AMP requests
- Add support to show charts from JSON/REST endpoints
- Fix loading of Google Visualization javascript files
- Add simple editors for editing chart data
- Tested up to WP 5.2
3.1.3 – 2019-02-24
- Fix issue with changing column settings of the last column in table chart
- Add support for query language to get subset of data from Google Spreadsheet
- Fix conflict with jquery 3.3.x
- Migrated PHPExcel to PhpSpreadsheet
- Front end action ‘print’ should print the chart and fall back to printing the data
- Fix issue with table chart not showing in IE
- Fix issue with multiple instances of same chart not showing
- Fix issue with date type column does not work with Combo charts
- Tested with WP 5.1
3.1.2 – 2018-12-06
- Fix bug “Warning: A non-numeric value encountered”
- Tested with WP 5.0
3.1.1 – 2018-12-05
- Fix issue with Gutenberg support
- Fix issue with loading new Table chart
- Fix options that don’t work correctly with some charts
3.1.0 – 2018-12-03
- Add Table chart
- Fix date format in sample files
3.0.12 – 2018-10-11
- Added filter to enable users to change schedule of charts.
- Fixed bug with line chart with timeofday column.
- Fixed bug with scheduled charts that sometimes did not show updated data.
- Javascript can be customized on a per user basis that will not be wiped out on update.
3.0.11 – 2018-08-15
- Fixed issue with the Series Settings options for the Table Chart
- Fixed issue with chart showing “Table has no columns” with remote sources
3.0.10 – 2018-07-20
- Fixed problem with chart reverting to the default values
- Fixed problem with Boolean column type
- Fixed problem with the Geo chart type not saving colors options
3.0.9 – 2018-07-12
- New chart title option for the back-end of the charts that don’t allow a title on the front-end
- Store the png images of the charts in a global array that can be used in JS
- Added options for charts animations
3.0.8 – 2018-06-27
- Added revision support for the chart post type
- Added both % and Value to the Pie Slice
- Use the blog locale for Visualizer’s options
- Fixed issue with data being fetched from the remote source every single time the chart was shown
- Fixed issue with scheduled charts not being updated if one of the scheduled charts is deleted
3.0.7 – 2018-03-26
- Adds insert button in chart library.
- Remove frontend assets where they are not needed.
- Improve non-English charts compatibility.
- Adds a filter to change charts locale.
3.0.6 – 2018-02-27
- Fix UTF-8 support while saving the data.
- Improve editing experience.
- Improves compatibility with Premium version.
- Adds chart button into TinyMCE editor.
3.0.5 – 2018-01-05
- Fix chart rendering bug in firefox.
- Fix review notification.
3.0.4 – 2017-11-27
- Fix for review message notification.
3.0.3 – 2017-11-16
- Adds compatibility with WordPress 4.9.
3.0.2 – 2017-10-10
- Fix dependency for composer dependencies.
3.0.1 – 2017-10-06
- Improved compatibility with various theme and plugins.
- Fix for chart type selection when creation from media popup.
3.0.0 – 2017-09-05
- Adds support manual configuration according to Google Visualization API.
- Improves compatibility with more features from the pro version.
2.2.0 – 2017-08-16
- Added custom number format for pie chart.
- Added frontend actions buttons ( Print, Export to CSV, Export to Excel, Copy)
2.1.9 – 2017-07-10
- Fixed display error with hex color.
2.1.8 – 2017-07-03
- Added chart title into library.
- Fixed SDK issues with dashboard widget.
2.1.7
- Updated sdk loading logic.
2.1.4
- Fixed issues with non-latin chars on CSV files to import.
2.1.2
- Fixed priority issue with wp_enqueue_media
- Added latest version of sdk
2.1.1
- Fixed charts bliking on some themes.
2.1.0
- Fixed geomap issue with apikey.
- Fixed responsive issues on tabbed interface and page builders.
- Added compatibility with premium import from posts/page feature.
2.0.4
- Fixed resize issue in the library page.
2.0.0
- Improved design and layout to support multiple datasources.
- Added new integrations in the Pro version.
- Added opt-in for tracking.
1.7.6
- Fixed issue when using the same shortcode multiple times on the same page.
1.7.5
- Removed footer banner upsell
- Fixed series settings issue
- Fixed issue with comas being used in numbers
1.7.2
- Improved charts responsive system
1.7.1
- Fixed grid lines error links
1.7.0
- Fixed responsive issues
- Fixed issues with zero margin values
- Fixed import issue
1.6.6
- Fixed charts resizing on tabbed content
1.6.5
- Fixed responsive issue
- Fixed no axis text color for line and bar charts
1.6.0
- Fixed security issue when importing charts
- Removed pointer for the pro version
- Fixed charts import from media library
- Added support to show legend on the left side
1.5.6
- Added support for 3 more chart types
- Fixed issue with charts not saving
1.5.5
- Added export for charts
- Enable default value for focus target. Fixed issue with hover which was not working on some machines.
1.5.4
- Added free search text over graphs
1.5.2
- Added step2 and 3 into step 1
1.5.1
- Fixed bug with from web button
1.5
- Added support for live editor
- Added support for importing data from other charts
- Added filter for chart settings
- Fixed bug when zero was not working on the charts
1.4.2.3
- Capacidad implementada para editar el formato de número de eje horizontal y vertical para gráficos de barras y columnas
1.4.2.2
- Se agregó la capacidad de aprobar una clase para div
- Se agregó la etiqueta adecuada para la publicación personalizada típica
1.4.2.1
- Se solucionó el problema con la función download_url que no existe en el front end
- Funcionalidad agregada que impide el acceso directo a la carpeta de plugins
1.4.2
- Se solucionó el problema de carga remota de CSV cuando la opción allow_url_fopen está deshabilitada en php.ini
- Se reemplazó la imagen flattr en el widget y se agregó un enlace de donación a los metadatos del plugin
- Mensaje de notificación agregado en la página de la biblioteca cuando la opción allow_url_fopen está desactivada
1.4.1.1
- Se eliminó la constante de escape del analizador CSV para evitar advertencias que aparecen cuando se usa PHP 5.2.x o menos
1.4.1
- Problema solucionado que impide que el complemento funcione en el backend SSL
- Se solucionó el problema con la carga de archivos CSV en IE y otros navegadores
- Se solucionó el problema con las series vacías, que aparece debido al espacio inicial en un archivo fuente
- Se agregó la capacidad de definir delimitador personalizado, cerramiento y variables de escape para el análisis CSV
1.4
- Implemented aggregation target and selection mode options for candlestick chart
- Se implementó el objetivo de enfoque y la opacidad de datos para caracteres en columnas.
- Se implementó la opacidad de datos y la configuración de nulos interpolados para el gráfico de líneas
- Capacidad implementada para editar la configuración de información sobre herramientas
- Se implementaron nuevas configuraciones para gráficos lineales como el modo de selección y el objetivo de agregación
- Se implementó la configuración de área y opacidad de puntos para el gráfico de área
- Se implementaron nuevas configuraciones para el gráfico circular, como el agujero circular, el ángulo de inicio y el desplazamiento de corte
- Capacidad implementada para seleccionar un color para el título del gráfico y los elementos de la leyenda
- Configuración de formato de número fijo para gráficos lineales, a partir de ahora solo funciona para etiquetas de eje
- Se modificó la sección de configuración general moviendo la configuración de título y fuente a grupos separados
1.3.0.2
- Enlaces reemplazados a github wiki
1.3.0.1
- Botón Flattr agregado
1.3.0
- Capacidad implementada para establecer formateadores de número y fecha
- Capacidad implementada para seleccionar fondo transparente para un gráfico
- Se corrigieron los errores de JS que aparecen cuando el soporte del editor de tipo de publicación está deshabilitado
- Problema solucionado con valores NULL para series numéricas
- Se corrigieron los gráficos no válidos que se mostraban en la biblioteca “Agregar medios”
- Se corrigió el problema de compatibilidad con otros complementos relacionados con la API de Google
- Se agregó el cuadro “calificar el complemento”
1.2.0
- Se implementaron configuraciones de líneas de cuadrícula menores.
- Se implementó la configuración de la ventana de visualización.
- Error con valores flotantes ha sido corregido. La configuración de los ejes horizontal y vertical se dividió en grupos separados.
1.1.4
- Error con valores flotantes ha sido corregido.
1.1.3
- Se solucionó el problema con la “advertencia de fseek” para la fuente del documento de hoja de cálculo de Google.
1.1.2
- Se han solucionado los problemas de compatibilidad con WordPress versión 3.6.
1.1.1
- La pestaña de tipo activo en la biblioteca de gráficos fue corregida.
- Se actualizaron los estilos de la biblioteca.
1.1.0
- La población automática se agregó para la fuente remota de archivos CSV.
- Se implementó la capacidad de enganchar series de gráficos y datos.
- Se implementó la capacidad de cargar archivos CSV desde la web.
1.0.1
- El error con la carga de archivos CSV fue corregido.
1.0.0
- The first version of what wil be the best wp charts plugin.
